Providing confidence every step of the way.
Gallagher is a global leader in insurance, risk management & consulting services helping clients face challenges and providing effective solutions.

Gallagher is a global leader in insurance, risk management & consulting services helping clients face challenges and providing effective solutions.
Gallagher is here to help you face any risk, anywhere in the world. Find out how in our new video with Chairman, President and CEO, Pat Gallagher.
Gallagher provides insurance, risk management and consulting services to business, communities and people around the globe.
In every community where we do business, more than 52,000 Gallagher colleagues create and follow a culture based on strong values, collaboration and professional excellence.
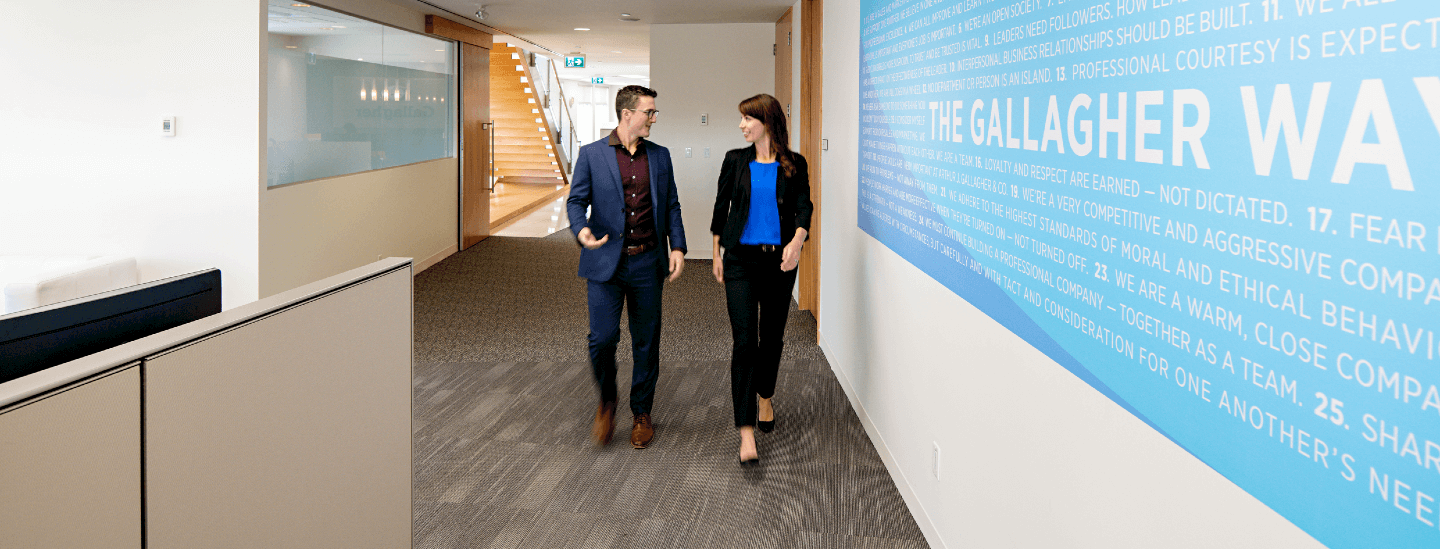
Learn about usSince 1927, Gallagher has led with integrity, ethics and purpose — the building blocks of The Gallagher Way.
We're a global leader in business insurance. Bringing both economies of scale and the stability of over 90 years of excellence to your business.
*Revenue is total adjusted brokerage and risk management revenue.
In a world of opportunities we're at your side. With a network of more than 960 offices across the globe. Because there's no substitute for local expertise.
From coast to coast, we’re part of the fabric of life throughout the country. Ready to do business where you do business.


